The quiet slide: when a model keeps shipping but outcomes get worse
You ship the model, dashboards look fine, and nothing crashes. Then a month later support tickets climb, conversion dips, or ops complains the queue “feels different.” When you finally dig in, the model has been making slightly worse calls the whole time, just not enough to trigger an obvious alarm.
This usually happens because inputs shift in small ways: a new marketing channel changes traffic, fraud tactics move, pricing rules update, or a feature starts arriving late. The painful part is you often can’t confirm it quickly—labels lag, and business outcomes mix in seasonality and promotions.
By the time you’re sure, the damage is already done, and fixing it gets harder under pressure. The real problem is deciding whether you’re seeing real drift, normal noise, or a broken data feed.
An alert fired—did the world change, or did your data feed break?
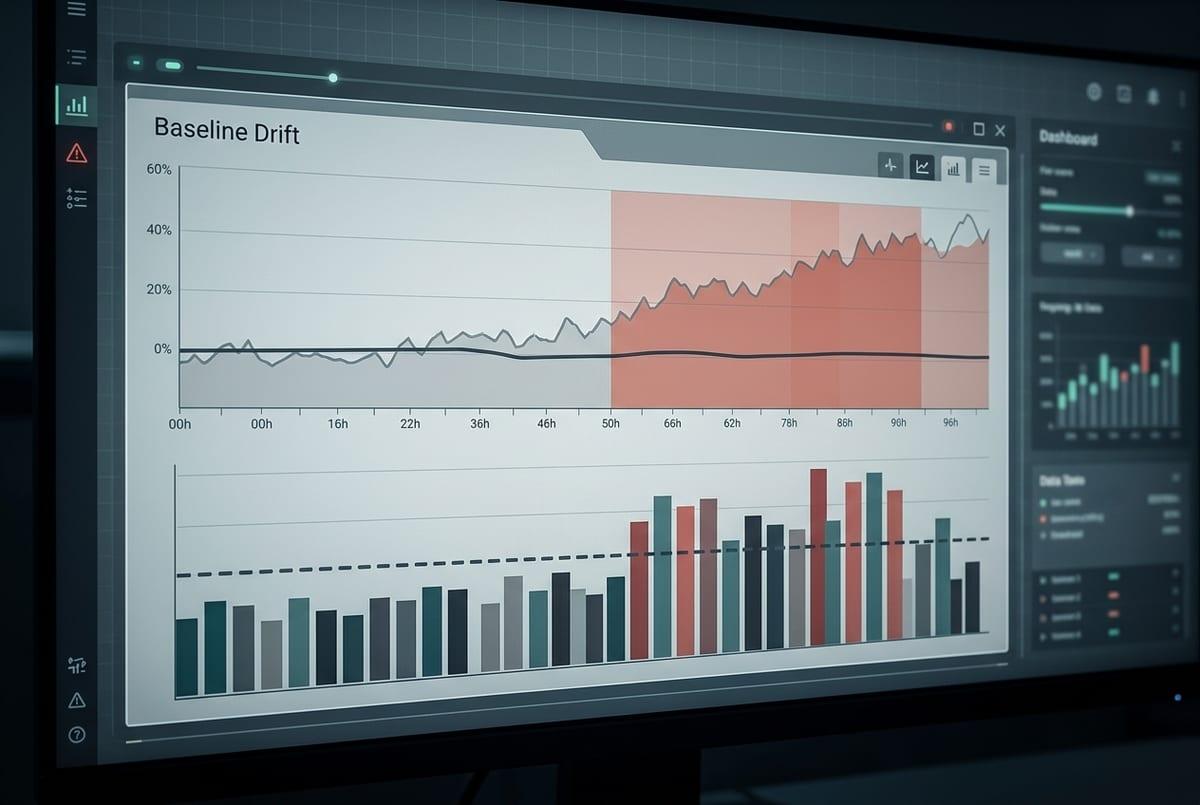
That decision gets urgent the moment an alert pings at 2 a.m. The distribution chart shifted, prediction scores look “off,” and the business asks if it’s safe to keep the model running. Before you debate retraining, assume the boring failure mode: the world might be fine, and your inputs might not be.
Start with the fast checks that catch most false alarms. Did a schema change rename a column or flip a type? Did a join drop rows so a default value suddenly fills half the traffic? Did a source start backfilling and send yesterday’s records again? Compare raw row counts, null rates, unique IDs, and feature ranges to the last known-good day, and do it per segment (channel, region, device) so a localized break doesn’t hide in aggregates.
The catch is these checks take access and time you may not have in the on-call moment, especially with third-party feeds. If the feed looks healthy, then you can treat the shift as real and ask what kind of drift it is.
What drift usually is in production (and why “concept drift” is only one slice)
If the feed looks healthy, the next mistake is treating “drift” as one thing. In production, the most common drift is simpler: the mix of inputs changes. New customers arrive, a channel ramps, a product bundle gets popular, and the feature values you trained on stop looking like today’s traffic. The model can still be “right” in the old world and still hurt you now.
Concept drift is narrower: the relationship between inputs and outcomes changes. Fraudsters adapt, pricing rules change incentives, or a new policy alters who gets approved, so the same features no longer mean the same risk. There’s also label shift, where base rates move—chargebacks spike or demand drops—so even a stable model output maps to different business impact.
The hard part is you often won’t know which is happening because labels arrive late and stakeholders want an answer now. That’s why early monitoring has to lean on signals you can compute immediately, even without ground truth.
No labels yet: which early signals are actually worth alerting on?
“Signals you can compute immediately” usually starts as a tempting mess: you can chart every feature, every score bucket, every segment, and still miss the one change that matters. In practice, you want a small set of checks that answer two questions fast: did the inputs stop resembling training traffic, and did the model start behaving differently on today’s requests?
Without labels, the most useful alerts tend to be about integrity and shape. Integrity is row counts, missingness, default-value spikes, and duplicates by key—things that break silently when a join changes or a feed lags. Shape is a short list of high-leverage features (the ones the model uses heavily or that drive business policy) plus the prediction score distribution. Add simple segmentation so you can see “all of iOS paid traffic shifted” instead of a blended average that looks normal.
Be careful with “distance” metrics as a primary pager. They fire constantly during normal seasonality and traffic mix changes, and people learn to ignore them. A better trigger is sustained change plus volume: the shift persists for hours/days and touches enough requests that it can move a KPI, which sets you up to decide whether to watch, triage, or intervene.
Your drift charts moved—how to tell “normal volatility” from “this will hurt”
That “watch, triage, or intervene” call usually comes down to whether the movement is brief and explainable, or sustained and concentrated where it matters. A score histogram that wobbles during a promo day is normal. The same wobble, every morning for a week, only on a high-revenue channel, is how quiet damage starts.
Use a baseline with bands, not a single threshold. Compare today to the same day-of-week and hour-of-day over the last few weeks, and do it per segment you’d actually make a decision on (top channels, top regions, key devices). Then sanity-check exposure: if the shifted segment is 2% of traffic, you can usually watch; if it’s 40%, assume it can move a KPI. Finally, look for “shape change,” not just “level change”—new score modes, collapsed variance, or a new spike at a default value.
The annoying part is low-volume segments look wild even when nothing is wrong, so you’ll need minimum counts and smoothing. When the change still holds up, you’re ready to pick the next step without making it worse.
When drift looks real: pick the next step that won’t make it worse

In practice, the moment drift “holds up,” people reach for the biggest lever: retrain. That can backfire if what changed is temporary (a campaign) or if your labels are lagging and biased toward a weird slice of traffic. Start with the least risky move that reduces harm: tighten or relax a threshold, cap an action (like max discounts), or route the shifted segment to a safer fallback rule.
If the scores moved but the inputs look sane, run a quick shadow test: keep serving the current model, but log what a candidate model or simple baseline would have done on the same requests. If only one segment shifted, consider segment-specific thresholds before a global retrain. If inputs shifted because a key feature lost coverage or timing, fix that first—retraining on broken features just bakes the break in.
Have a clear “stop the bleeding” condition: a KPI guardrail, an error budget, or a max percent of traffic you’ll expose. Then you can decide when to rollback versus when to keep learning from fresh data.
A monitoring setup that gets you paged before the business does
That “stop the bleeding” condition only works if it can wake you up fast. The setup that pays off is boring: feature and join health checks on every batch/stream (row counts, null rates, default spikes, freshness), plus score-shape checks with day-of-week baselines and minimum-volume rules. Wire alerts to the same segments you can act on—top channels, regions, devices—so the page already includes where to look.
Then connect it to a clear playbook: “data broke” routes to the pipeline owner; “shifted segment” routes to threshold caps or fallback rules; “global shift” triggers a shadow run and retrain ticket. Expect cost: storing logs, keeping baselines current, and resisting alert sprawl is ongoing work.
When your pager fires with scope, impact, and an owner, you usually beat the KPI meeting.