When the dashboard can’t see your best signals (yet)
You open a dashboard to explain why a metric moved, and the numbers look clean—yet the “why” lives somewhere else. It’s in a customer email thread, a support ticket description, a call note, or a PDF someone attached and forgot. The moment you try to answer a simple question like “Which issue type drove churn last month?”, you end up searching inboxes and copying snippets into a spreadsheet.
That work doesn’t scale. Two people tag the same message differently, categories drift over time, and the backlog grows faster than your team can label it. Even worse, the findings can’t be joined back to accounts, products, regions, or cohorts in a consistent way.
It’s to turn the best signals into fields your dashboard can filter, group, and trend—starting with the sources that pay you back fastest.
Which unstructured sources are actually worth starting with?
“Pay you back fastest” usually means the text that already shows up in a repeatable workflow. If your support team logs every case in a ticketing system, those descriptions are a strong start: they’re time-stamped, tied to a customer, and already have basic metadata you can join to accounts and product usage. Call notes can work too when they follow a template (“reason,” “next step,” “competitor mentioned”), because the model has fewer ways to misread what matters.
Emails and shared inboxes often look tempting, but they’re messy. Threads mix topics, forwards pull in old context, and customer identifiers get dropped. PDFs are similar: the content is rich, but you’ll spend time just getting clean text and separating “real” terms from boilerplate.
Start where you can reliably link each record to an account, a date, and a clear event—then expand once the joins hold up under pressure.
You don’t need “perfect NLP”—you need fields you can join and trend
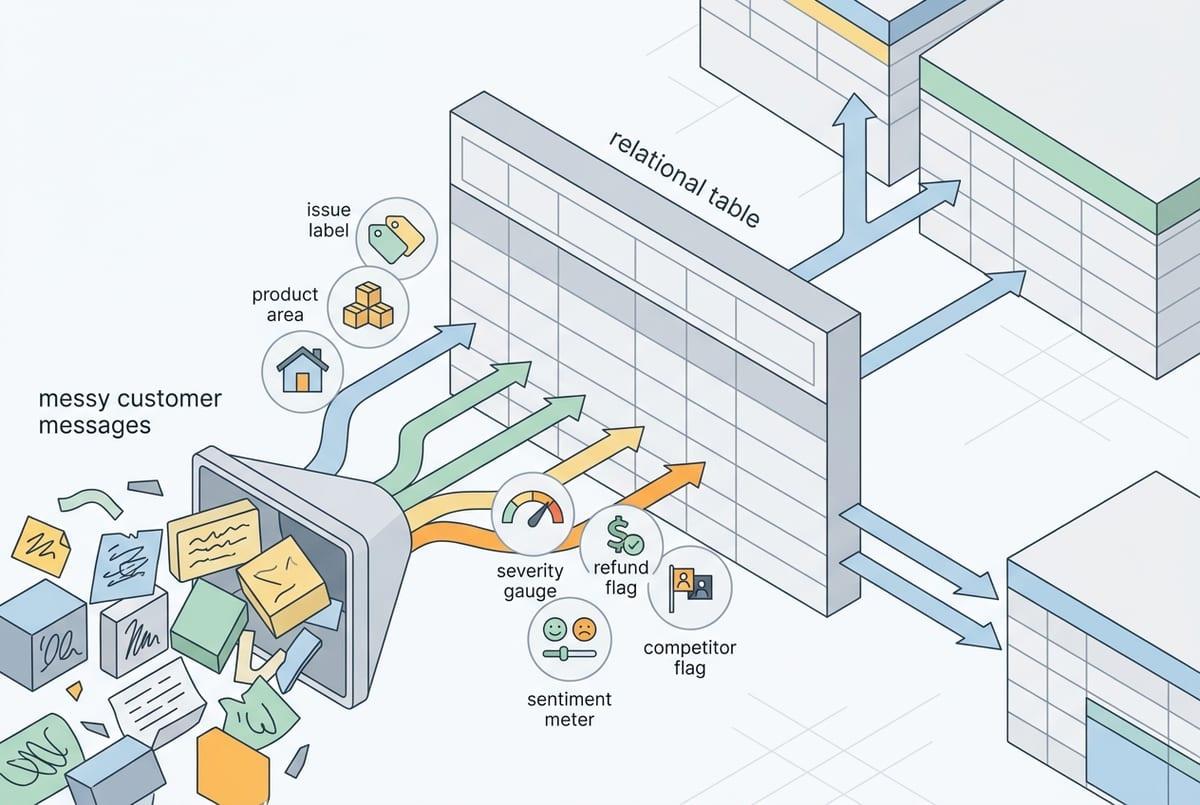
“Joins that hold up under pressure” is where most AI text projects win or lose. In practice, you don’t need a model to fully understand a message. You need it to pull out a small set of fields that behave like the rest of your data: an issue label you can group by, a product area you can filter on, a sentiment or urgency score you can trend, and a few boolean flags (“refund requested,” “competitor mentioned”).
Start by writing the table you wish you had. For a support ticket, that might be: ticket_id, account_id, created_date, primary_issue, secondary_issue, feature_name, severity, and “first_time_vs_repeat.” If you can produce those consistently, you can slice churn by primary_issue, watch severity over time, and tie spikes to a release window.
If “severity” means “customer tone” one month and “business impact” the next, your trend breaks and trust drops fast—so define each field in plain language before you automate it.
Where extraction breaks in real life: ambiguity, missing context, and moving definitions
Even with a clean definition, the text won’t cooperate. A rep writes “high priority” and means “angry tone,” while another means “enterprise account.” A ticket says “can’t log in,” but the real problem is MFA, SSO, a locked account, or a browser extension—and the difference matters when you try to group issues and decide what to fix.
Missing context is the quiet failure mode. Short notes like “same as last time” or “customer wants the usual discount” assume the reader remembers a prior call, a contract term, or an account history. If the model only sees the current message, it will guess—or it will leave the field blank. Both outcomes break joins and trend lines, especially when you later compare regions or teams with different note-taking habits.
Product names change, features get bundled, and your “churn risk” language shifts after a new playbook rollout. Unless you version labels and keep a mapping (“old term” → “new term”), your dashboard will show fake spikes that are really taxonomy drift. That’s why the next decision is practical: how accurate is “accurate enough,” and where does human review step in?
How much accuracy is enough—and what does human review look like?

When you first pilot extraction, you’ll see a familiar pattern: the dashboard looks plausible at a glance, but a handful of wrong labels can swing a trend line or send a team chasing the wrong fix. “Accurate enough” depends on what you do with the field. If it only supports internal discovery (like clustering complaints), you can live with more noise. If it drives alerts, routing, or exec reporting, you need tighter control.
Set thresholds by field type. For joins (account_id, product, feature_name), treat errors as expensive because they break slices and inflate counts; aim for near-zero mismatches and prefer “blank” over a guess. For softer fields (sentiment, urgency), consistency matters more than perfection, so monitor whether the direction and ranking hold week to week.
Human review usually works best as a targeted queue, not a full audit: sample a fixed percentage, and route only low-confidence or high-impact records (enterprise accounts, severe issues) to a reviewer. The hard part is staffing the peaks—like after a big release—so define who reviews, how fast, and what happens when the queue backs up before you wire this into production.
Privacy and integration headaches: what to settle before you build momentum
Before you wire this into production, the questions turn less “Can we extract it?” and more “Where does this text go, and who can see it?” Support tickets and call notes often contain PII, health details, or payment snippets. Set the rule up front: what must be redacted, what can be stored, and how long. Also decide whether prompts and outputs can be logged for debugging, because logs become another place sensitive data can leak.
Integration is the other slow-down. If the extracted table can’t land in the same place as your account and product data, joins will stay brittle. Pick a system of record (warehouse, CRM, ticketing), define stable IDs, and plan for reprocessing when labels change. Expect time here: permissions, API limits, and broken templates show up right when volume spikes.
With those guardrails set, you can design a pilot you can defend.
A pilot you can defend: success metrics, scope, and a build-vs-buy shortlist
That defensible pilot starts with one workflow and a small, fixed schema. Pick a single source (say, support tickets) and 3–6 fields you’ll actually chart, plus one join key you can validate (account_id or ticket_id). Define success as: join rate, “blank over guess” rate on join fields, week-over-week label stability, and reviewer minutes per 100 records.
Keep scope tight: one team, one product area, and a date window you can replay. Budget for reprocessing and for review spikes after releases—those are where timelines slip.
For build vs buy, shortlist on: data residency/retention controls, connectors to your systems of record, versioned taxonomies, and an audit trail. Choose the option that keeps your metrics reproducible when definitions change.