You shipped the model—now what counts as “working”?
The day after launch, somebody asks a simple question: “Is it working?” Offline accuracy won’t answer it. In production, a model can score well and still slow the page, recommend the wrong things for a key segment, or shift user behavior in a way that hurts your real goal.
If you can’t name one success signal that survives a bad week and a skeptical stakeholder, you don’t have a definition of “working” yet.
Pick a success signal your stakeholders will believe tomorrow
That “survives a bad week” test usually fails when the metric is either too far from the business or too easy to game. In a support-assist tool, “model accuracy” won’t persuade anyone on Friday; “tickets resolved within 24 hours” or “escalations per 1,000 tickets” might, because people already argue about those numbers.
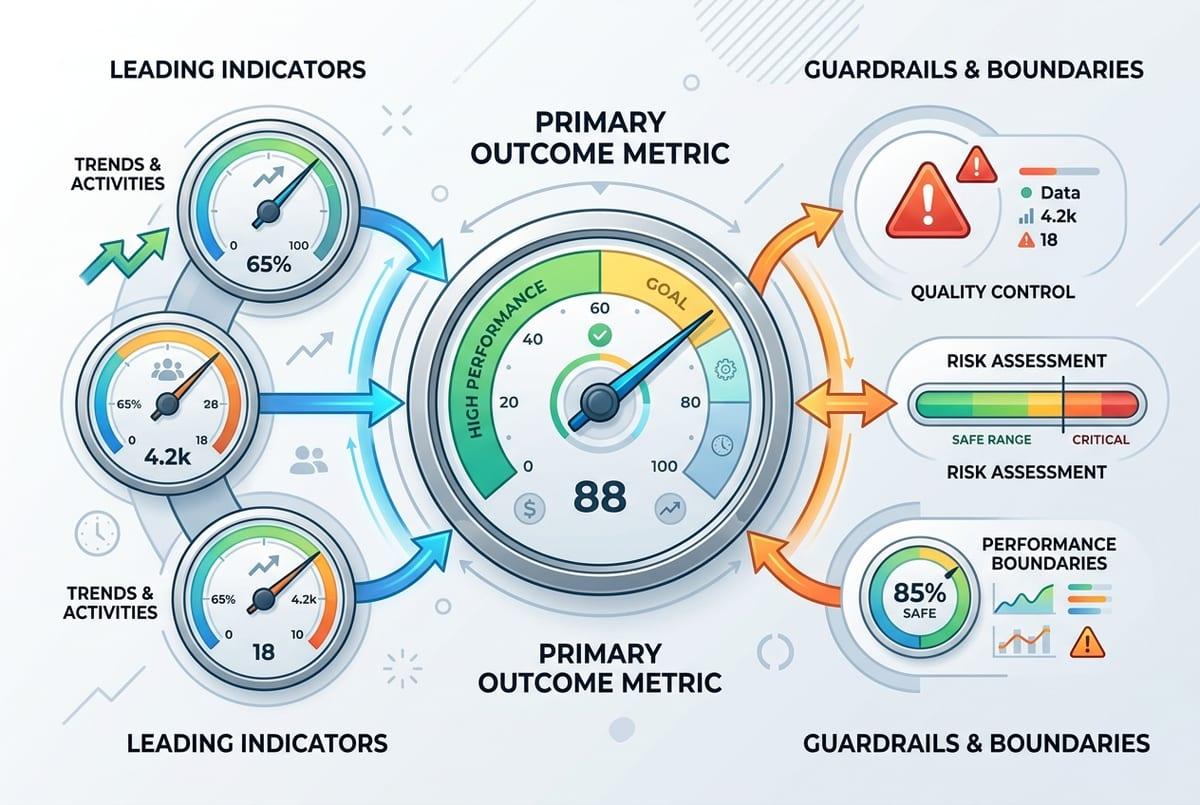
Pick one primary outcome metric, then add two kinds of companions: a leading indicator you can see quickly (accept rate, time-to-first-action, deflection rate), and guardrails that keep you honest (latency p95, cost per 1,000 requests, complaint rate). Write down who owns each number and what data source is “the” source, or you’ll spend your first incident debating dashboards.
You still won’t get clean causality without an experiment, and some teams can’t run one. That’s why your offline score needs a production baseline you can compare to without pretending it predicts impact.
Turn your offline score into a production baseline (and admit what it can’t tell you)
That baseline starts with what you already have: your offline score, plus the exact dataset and evaluation code that produced it. Freeze them. Log the model version, feature list, label window, and the slice results you care about (new users, high-value accounts, long-tail queries). Then treat that report as your “expected” behavior, not your promised impact.
In production, recreate the same measurement as closely as you can. If you can’t get true labels quickly, use delayed labels (next-day resolution outcome), human review on a small sample, or shadow-mode scoring where you compare model outputs to what the current system did. The goal is a stable number you can re-run after every deploy.
The hard part: offline can’t see feedback loops, UI latency, or policy changes. A model can keep the same offline AUC while users stop trusting the suggestions, so you need logs that explain changes when the baseline breaks.
First week in prod: what to log so you can answer “why did it change?”
When that stable number shifts, the first week usually turns into guesswork: “Did the model drift, or did we change the UI?” You avoid that by logging a small, consistent packet for every prediction. At minimum: a request ID, timestamp, model version, feature schema/version, key input fields (or hashes if sensitive), the raw score, the final decision after thresholds/rules, and latency and cost for that call.
Then log what the user actually saw and did. Capture the treatment (which variant, which copy, which ranking position), any overrides (agent edited it, user dismissed it), and the immediate outcome you can see right away (click, accept, time-to-next-action). If labels arrive later, log the join keys and the “label due date” so you can backfill cleanly instead of rebuilding history from scratch.
Expect pain: privacy reviews, storage bills, and missing context from upstream services. Start narrow, but include enough to replay a single bad session end-to-end—because the next question will be which kind of change you’re looking at.
When metrics move: drift, data bugs, or user behavior?
That “which kind of change” question usually shows up as a chart that slides over a few days. The fastest way to sort it is to check the plumbing before you debate the model. If feature null rates jump, a categorical value disappears, or the request mix shifts (mobile traffic spikes, a new country rolls out), treat it like a data or routing issue until proven otherwise.
If the inputs look stable but predictions change, compare distributions: score histograms, top features, and slice metrics you froze offline. A sudden shift right after a deploy points to code, thresholds, or schema drift. A slow shift over weeks often tracks real drift: the world changed, labels changed, or your model created a feedback loop by steering what users click.
One practical constraint: you won’t know which it is if your label join breaks or arrives late, so keep a “labels received” health metric beside the outcome metric.
The quiet failures you won’t see in averages
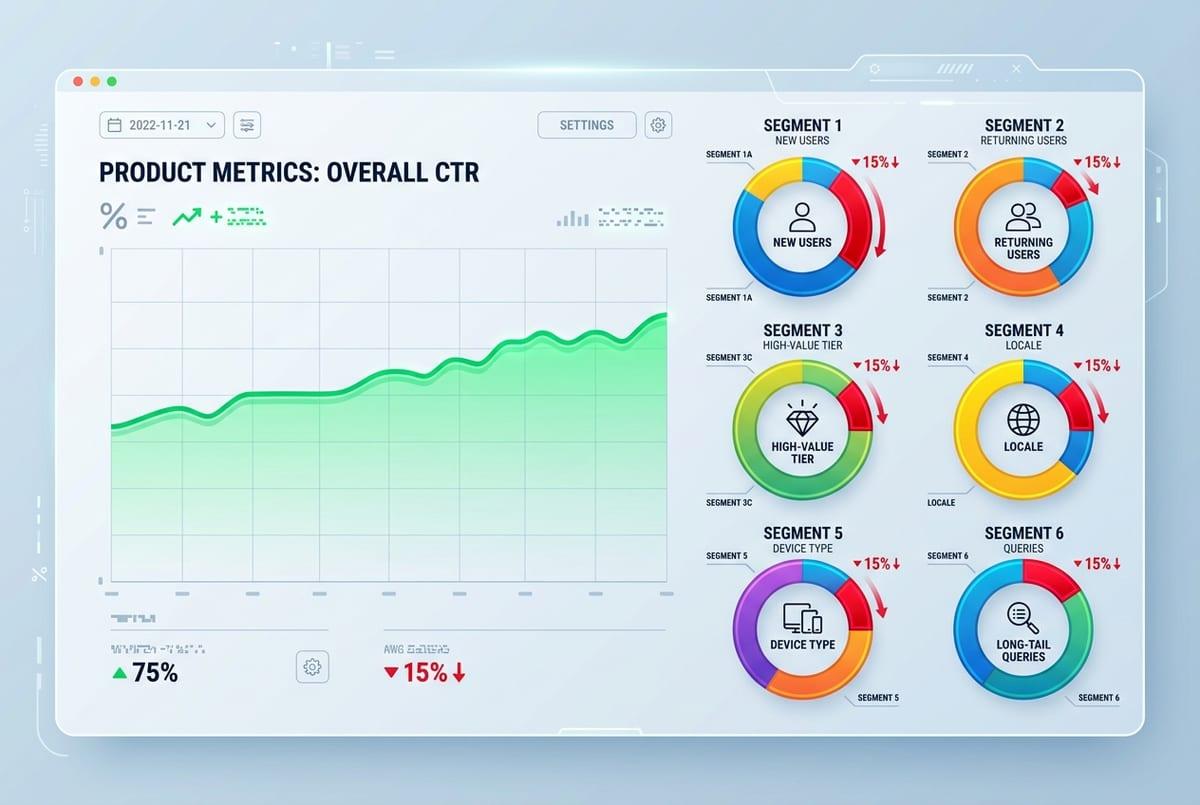
Keeping a “labels received” health metric helps, but it still won’t catch the cases where the average looks fine while a small group gets hammered. A ranking model can hold steady CTR while burying results for new users because returning users do all the clicking. A fraud model can keep the same loss rate while blocking a handful of high-value accounts and creating a support mess.
Make quiet failures visible by tracking slices that map to real product risk: new vs. returning, high-value tiers, locales, device types, and “hard” inputs (long-tail queries, rare categories). Don’t stop at performance. Add slice-level latency and cost, because one segment may hit a slower path or larger payloads.
The annoying part is volume: some slices won’t have enough events daily. Set expectations upfront and review them weekly, then decide what deserves a tripwire.
Decide your tripwires: alert thresholds, rollback, and retraining triggers
Once you decide what deserves a tripwire, the next question is what you’ll actually do when it fires. Start with three buckets: outcome, guardrails, and data health. For outcome, pick a threshold that matches how the business feels pain: “conversion down 3% week-over-week for 2 days” is often more believable than “AUC down 0.01.” For guardrails, use hard limits: p95 latency over 300ms, cost per 1,000 requests over $X, complaint rate over Y. For data health, alert on null spikes, schema version mismatch, and “labels received” dropping below a floor.
Then write the action, not just the alert. If latency blows up, roll back the model deploy. If the outcome metric tanks but inputs look normal, flip to a safe fallback (rules, previous model, or shadow mode) while you investigate. If drift shows up in a stable slice for a full label window, schedule retraining with a defined cutoff date.
Expect messy weeks: seasonality and promos will trigger false alarms unless you tie every tripwire to a specific owner, runbook, and decision deadline.
Your production evaluation plan, in one page
That decision deadline is where most teams stall, so put the whole plan on one page that anyone can run during an incident. List your primary outcome metric, one leading indicator, and 2–3 guardrails, each with: data source, owner, review cadence, and a baseline window. Add your “can’t be blind” slices and the minimum logs needed to replay a bad session.
Under that, write tripwires as if-then rules: if outcome drops X for Y days, do Z; if p95 latency exceeds N, rollback; if labels received falls below M, pause conclusions and fix the join. Keep a short runbook link and a fallback mode. The cost is upkeep: baselines rot after launches, promos, and policy changes, so assign someone to refresh them.